Landkreis Vulkaneifel |
|
|
Fläche: |
911,64 km2 |
|
Bevölkerung (31.12.20): |
61.912 EW |
|
Bevölkerungsdichte: |
67,8 EW/km2 |
Gemeinden, Einwohner und Flächen
|
Anzahl der Ortsgemeinden |
Einwohner am 31.12.2023 |
Fläche in km2 zum 31.12.23 |
Bev.dichte EW/km2 am 31.12.2023 |
||
|
VG Daun |
38 |
23.327 |
37,68 |
316,30 |
73,7 |
|
VG Gerolstein |
38 |
31.374 |
50,68 |
455,28 |
68,9 |
|
VG Kelberg |
33 |
7.211 |
11,64 |
140,06 |
51,5 |
|
LK Vulkaneifel |
109 |
61.912 |
100 |
911 |
67,9 |
|
Einwohner jeweils |
Veränderung zum zuvor |
||
|
Jahr |
zum 31.12. |
angegebenen Jahr |
|
|
absolut |
in % |
||
|
1990 |
58.980 |
||
|
1995 |
62.748 |
3768 |
6,00 |
|
2000 |
64.367 |
36 |
0,06 |
|
2001 |
64.464 |
97 |
0,15 |
|
2002 |
64.241 |
-223 |
-0,35 |
|
2003 |
64.285 |
44 |
0,07 |
|
2004 |
63.934 |
-351 |
-0,55 |
|
2005 |
63.646 |
-288 |
-0,45 |
|
2006 |
63.161 |
-485 |
-0,77 |
|
2007 |
62.813 |
-348 |
-0,55 |
|
2008 |
62.201 |
-612 |
-0,98 |
|
2009 |
61.789 |
-412 |
-0,67 |
|
2010 |
61.267 |
-522 |
-0,85 |
|
2011 |
61.533 |
266 |
0,43 |
|
2012 |
61.073 |
-460 |
-0,75 |
|
2013 |
60.765 |
-308 |
-0,51 |
|
2014 |
60.775 |
-31 |
-0,05 |
|
2015 |
60.794 |
19 |
0,03 |
|
2016 |
60.757 |
-37 |
-0,1 |
|
2017 |
60.705 |
-52 |
-0,1 |
|
2018 |
60.603 |
-102 |
-0,2 |
|
2019 |
60.646 |
+43 |
0,1 |
|
2020 |
60.491 |
-155 |
-0,25 |
|
2021 |
60.882 |
+391 |
+0,6 |
|
2022 |
61.769 |
+887 |
+1,5 |
|
2023 |
61.912 |
+143 |
+0,23 |
|
Jahr |
Anzahl Bevölkerung |
in % |
|
unter 20 Jahre |
10.800 |
17,4 % |
|
20 - 65 Jahre |
35.098 |
56,7 % |
|
über 65 Jahre |
16.014 |
25,9 % |
|
Jahr |
Lebendgeborene |
Gestorbene |
Zuzüge über die Kreisgrenze |
Fortzüge über die Kreisgrenze |
Gesamtsaldo |
|
1980 |
614 |
709 |
2.638 |
2.423 |
+120 |
|
1985 |
620 |
659 |
1.986 |
2.055 |
-108 |
|
1990 |
735 |
685 |
3.538 |
2.505 |
+1083 |
|
1995 |
666 |
734 |
2.948 |
2.432 |
+448 |
|
2000 |
605 |
680 |
2.584 |
2.473 |
+36 |
|
2002 |
522 |
729 |
2.270 |
2.286 |
-223 |
|
2003 |
539 |
718 |
2.435 |
2.212 |
+44 |
|
2004 |
514 |
746 |
2.152 |
2.271 |
-351 |
|
2005 |
510 |
778 |
2.158 |
2.178 |
-288 |
|
2006 |
453 |
721 |
2.036 |
2.252 |
-484 |
|
2007 |
504 |
684 |
2.056 |
2.224 |
-348 |
|
2008 |
428 |
738 |
2.054 |
2.356 |
-612 |
|
2009 |
455 |
821 |
2.063 |
2.113 |
-416 |
|
2010 |
440 |
747 |
1.922 |
2.138 |
-523 |
|
2011 |
392 |
711 |
2.049 |
2.350 |
-620 |
|
2012 |
438 |
768 |
2.181 |
2.322 |
-471 |
|
2013 |
463 |
728 |
2.385 |
2.433 |
-313 |
|
2014 |
462 |
733 |
2.600 |
2.317 |
+12 |
|
2015 |
439 |
823 |
2.911 |
2.502 |
+25 |
|
2016 |
486 |
836 |
3.167 |
2.840 |
-23 |
|
2017 |
481 |
801 |
2.948 |
2.662 |
-34 |
|
2018 |
455 |
837 |
2.936 |
2.624 |
-70 |
|
2019 |
461 |
806 |
2.933 |
2.528 |
+60 |
|
2020 |
449 |
846 |
2.692 |
2.444 |
-149 |
|
2021 |
471 |
866 |
3.156 |
2.357 |
+799 |
|
2022 |
517 |
889 |
4.021 |
2743 |
+906 |
|
2023 |
458 |
861 |
3277 |
2719 |
+155 |
|
Landwirtschaftsfläche |
375,48 km2 |
41,2 % |
|
Waldfläche |
397,47 krr)2 |
43,6 % |
|
Sonstige Vegetation |
25,80 krr)2 |
2,8 % |
|
Gewässer |
6,29 krr)2 |
0,7 % |
|
Siedlung |
49,79 km2 |
5,5 % |
|
Verkehrsflächen |
56,61 krr)2 |
6,2 % |
Wahlbeteiligung 65,8 %
Sitzverteilung Wahl zum Kreistag, Landkreis Vulkaneifel, Endergebnis
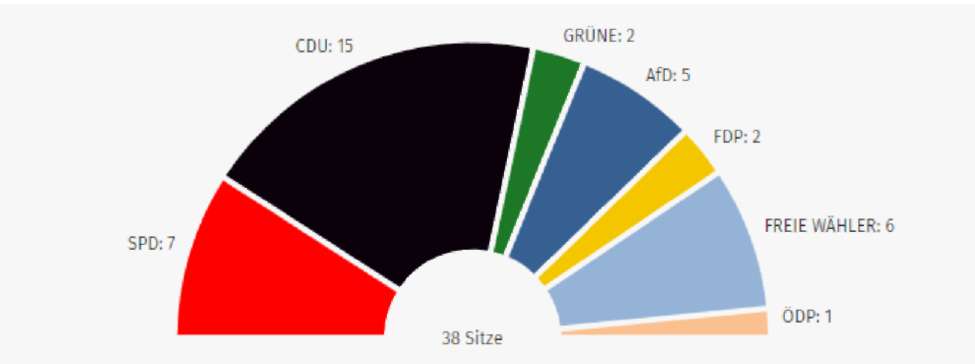

|
Partei |
Stimmen |
||
|
Anzahl c |
Anteil c |
Gewinn und Verlust in %-Punkten ; |
|
|
• SPD |
198.658 |
17,7 % |
-0,8 |
|
# CDU |
461.663 |
41,1 % |
0,6 |
|
• GRÜNE |
70.934 |
6,3 % |
-6,2 |
|
• AfD |
137.429 |
12,2 % |
8,7 |
|
FDP |
58.092 |
5,2 % |
-2,3 |
|
FREIE WÄHLER |
173.206 |
15,4 % |
4,5 |
|
ÖDP |
23.457 |
2,1 % |
2,1 |
|
Stimmberechtigte |
49.713 |
- |
- |
|
Wähler |
32.718 |
65,8 % |
3,3 |
Quelle: Stat. LA RLP/rlp-wahlen.de, Kreisverwaltung Vulkaneifel Zusammengestellt von Verena Bernardy, Kreisverwaltung Vulkaneifel